Explanation of the Logic Behind the Employment Analysis of the Teaching Chinese as a Foreign Language Major
I. Background
When it comes to the Teaching Chinese as a Foreign Language major, many people may think the employment situation is poor. But what it is really like is something most people judge subjectively. In order to study this question in depth, we need a quantitative method of evaluation. Therefore, I designed a gradient decomposition quantitative method [Quantitative Method of Gradient Decomposition], GMGD analysis for short.
II. What Is GMGD
GMGD analysis relies mainly on two kinds of data: first, survey data on the employment status of students who graduated from this major; second, industry experts’ ratings of each indicator. The importance that industry experts assign to each indicator is used as the coefficient for each item of the graduate survey. Each item’s coefficient is then multiplied by its score, and finally the scores of all items are added up to obtain the final employment score for each graduate.
Suppose a graduate’s final score is W, salary and benefits are S, job stability is T, career development is D, and the experts’ importance coefficients for these three indicators are Ks, Kt and Kd respectively. Then W= S*Ks + T*Kt + D*Kd
Of course, the actual design is much more complicated than this, because the importance of indicators is graded into levels, because blah blah blah, write this part yourself
1 Algorithm for the Weight Coefficients
So we first need to divide things into dimensions. The three dimensions differ in importance, which is reflected in the expert questionnaire as reasonableness. Let the full reasonableness score for employment efficiency, career status and career happiness each be F, and let the expert rating for employment efficiency be E, for career status S, and for career happiness H. Then their respective weight coefficients are
- E/(E+S+H)
- S/(E+S+H)
- H/(E+S+H)
Let W be the final score. Then the points allocated to each item are:
- W*E/(E+S+H)
- W*S/(E+S+H)
- W*H/(E+S+H)
Under each dimension there are several corresponding first-level indicators. Let the expert ratings for employment cost and employment effectiveness be E1 and E2 respectively (the full reasonableness score is still F). Then their respective allocated points are
- W*E*E1/[(E+S+H)*(E1+E2)]
- W*E*E2/[(E+S+H)*(E1+E2)]
Dividing further down into second-level indicators works the same way. Let job-search time, job-search frequency and the financial cost of the job search be E11, E12 and E13 respectively. The corresponding points are
- W*E*E1*E11/[(E+S+H)*(E1+E2)*(E11+E12+E13)]
- W*E*E2*E12/[(E+S+H)*(E1+E2)*(E11+E12+E13)]
- W*E*E2*E13/[(E+S+H)*(E1+E2)*(E11+E12+E13)]
The other second-level indicators work the same way
2 Scoring the Graduate Questionnaire
First, assign a score to each questionnaire item, taking this one as an example
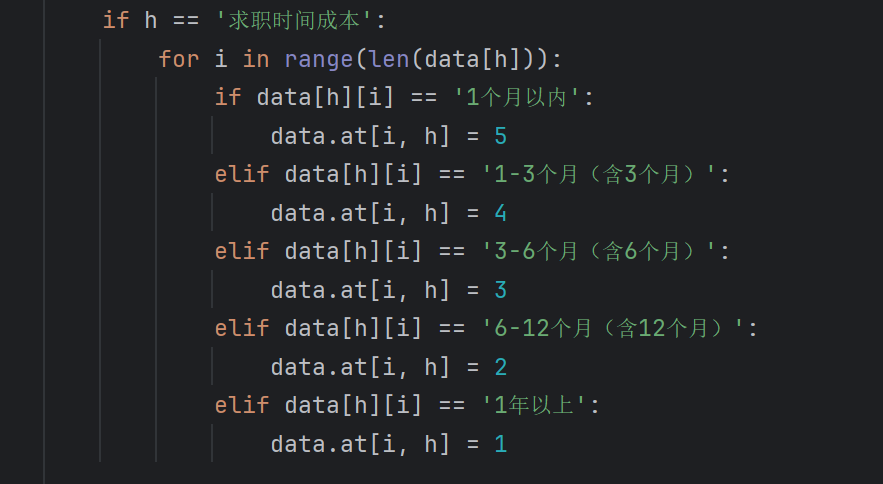
Explain for yourself why it is designed this way
The others should probably also have an explanation like this, or be described in the same way
We know that the full score for job-search time cost is W*E*E1*E11/[(E+S+H)*(E1+E2)*(E11+E12+E13)]. If a graduate found a job within one month, I consider their score to be the full score; if their job search took more than a year, I consider them to have received only 1/5 of the total score (since there are only five values), i.e.
W*E*E1*E11/[(E+S+H)*(E1+E2)*(E11+E12+E13)]/5
So, suppose that an indicator in the student questionnaire shows n different cases among the 400 graduates. First I sort them in order of progression. The score for the first case is D1 (PS: D1 is a positive constant), the score for the second case is D2 = D1 + D1, the third D3 = 3*D1, and so on, with the n-th being Dn = n *D1 (this case is the full score)
Then the i-th case is equivalent to getting this share of the total score:
i*D1/(n*D1)
We know that the total score for this item is
- W*E*E1*E11/[(E+S+H)*(E1+E2)*(E11+E12+E13)]
So a student rated in the i-th case scores the following on this item
- W*E*E1*E11*i/[(E+S+H)*(E1+E2)*(E11+E12+E13)*n]
3 Calculating the Final Score
Finally, calculate each graduate’s score by adding up all the indicators, i.e.:
W =
W*E*E1*E11*i/[(E+S+H)*(E1+E2)*(E11+E12+E13)*n]+
W*E*E1*E12*i/[(E+S+H)*(E1+E2)*(E11+E12+E13)*n]+
W*E*E1*E13*i/[(E+S+H)*(E1+E2)*(E11+E12+E13)*n]+
W*E*E1*E13*i/[(E+S+H)*(E1+E2)*(E11+E12+E13)*n]+
…
If you need to derive a formula with the [sigma] summation symbol, you have to drop the concept of dimensions and assume that, starting from the first-level indicators, there are infinitely many indicators, and that under each indicator there are infinitely many multi-level indicators, e.g. first-level indicators, second-level indicators… 99th-level indicators
The resulting formula will contain Π (infinite product) and Σ (infinite sum)
Suppose the number of indicators at every level is M
W = W * i * Π1-i / Σ1-M[Π1-M *(Σi-n)*n]. This is abbreviated and not very pretty; written out in full it is very complicated. I haven’t thought it through carefully yet and can’t guarantee it’s 100% accurate; it would take at least an hour or two of thought
III. How to Do It
To complete this work, I need to perform many complex calculations, so I use Python to compute the data in batches
Suppose the total employment score is 100 points
- Determine the weight coefficients of the dimensions: use the expert questionnaire’s reasonableness ratings for the three dimensions as the basis for calculation—the higher the rating, the greater the importance—and from this calculate each dimension’s percentage of the total score and how many points it accounts for
- Continuing downward, each dimension has several first-level indicators beneath it. Use the expert questionnaire’s reasonableness ratings for those first-level indicators as the basis for calculation to work out the weight of each first-level indicator
- Likewise, the second-level indicators sit under the first-level indicators and follow the same logic
This way I have the score for every survey item in the student questionnaire, and this score is out of the 100 points